Human Blood Smears (ID: 1, ID:3) #BIOE 301C
 May 25, 2018 • 3:01 PM UTC
 Unknown Location
 140x Magnification
 Unknown
Elle Robinson
Learn about the author...
3posts
0comments
1locations
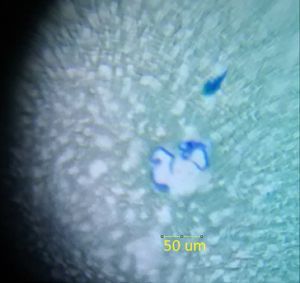
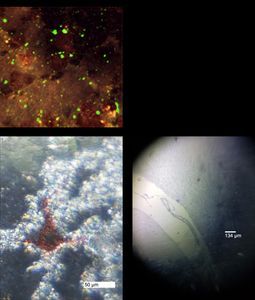
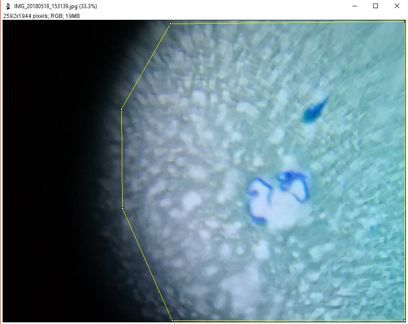
ID:1 Southeast Asia, Human blood smear, Prakash Lab The ID:1 sample was a human blood smear from Southeast Asia, stained and fixed on a microscope slide with coverslip. The defining features in this sample are the large worms stained bright blue. These are parasitic filial worms, Brugia malayi . These worms cause lymphatic filariasis also known as elephantiasis.
The smaller blue-stained object is debris. Morphologically, these worms are long, thread-like with a round anterior and pointed posterior. There are RBCs (red blood cells or erythrocytes) on the slide but since the worm has Z-depth, worms are in focus and the RBC monolayer is out of focus. Prevalence was 2 worms on the entire slide. Using the assumptions described for the other sample (ID:3) we estimate parasite concentration in the image is (2 worms / 3114261*10 pixels). Note this is multiplied by 10 to approximate the entire area of the microscope slide under view. This gives an approximation of 3.9 million worms in this person’s bloodstream.
Scale bar was created on the other sample (ID:3) by calculating the average number of pixels corresponding to the known size of a fixed erythrocyte (5 um). Since magnification didn’t change between samples, the same image scale was used here.
View in Media Gallery
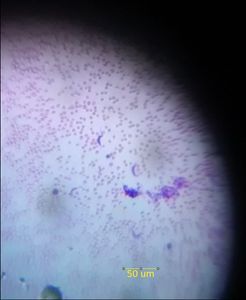
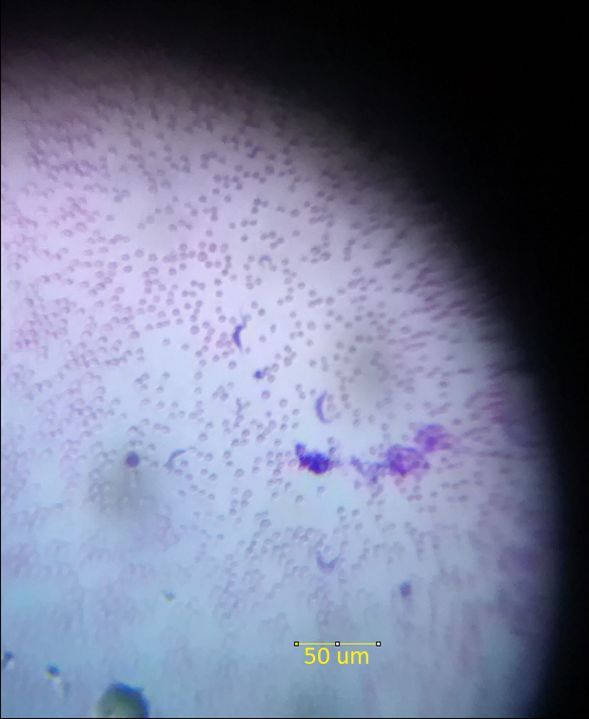
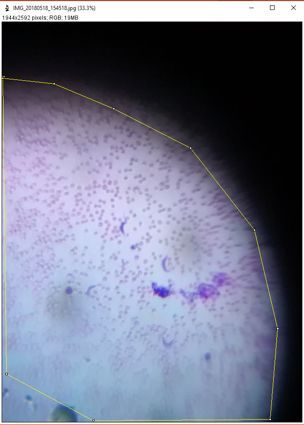
ID:3 Africa, Human blood smear, Prakash Lab The ID:3 sample is a human blood smear from Africa, stained and fixed on a microscope slide with cover slip. The defining features of this sample are the small, curly-shaped cells stained purple. These cells are parasitic protozoans, Trypanosoma brucei , which cause African sleeping sickness. The stained amorphous blobs are debris. The smaller, round, lightly stained cells are RBCs.
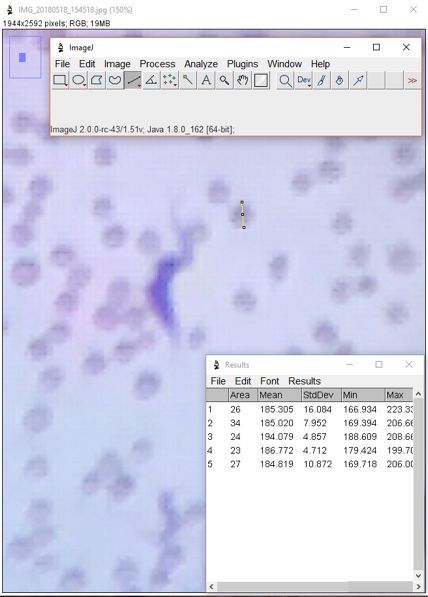
Prevalence in the sample is 4 parasitic cells visible in the field of view. Scale bar: Using the ImageJ measure tool, the average number of pixels corresponding to the known size of a fixed erythrocyte (5 um) was calculated as 27 pixels. Scale bar was created by multiplying by 10 and drawing and measuring a line segment of this length. Prevalence: Estimate the blood volume present per unit area in the image by counting RBCs and comparing them to expected concentration in the blood.
Assume:
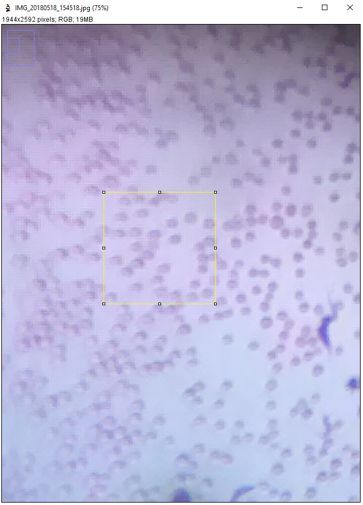
5 million RBCs / uL in a normal human 5 L blood in a human By counting within a fixed area of the image 276×276 pixels (5 um^2), we find 33 RBCs. Using our assumptions, we get 2.7e-4 uL / 5 um^2 blood volume per unit area of the image. Concentration is # parasites / the area of the entire image (4 parasites / 3114261 pixels). Scaling this up to 5.5L in a human, we get 82 million parasites in this person’s bloodstream.
How we used Image J to get a scale bar:
Prevalence in the sample is 4 parasitic cells visible in the field of view. Scale bar: Using the ImageJ measure tool, the average number of pixels corresponding to the known size of a fixed erythrocyte (5 um) was calculated as 27 pixels. Scale bar was created by multiplying by 10 and drawing and measuring a line segment of this length. Prevalence: Estimate the blood volume present per unit area in the image by counting RBCs and comparing them to expected concentration in the blood.
Assume:
5 million RBCs / uL in a normal human 5 L blood in a human By counting within a fixed area of the image 276×276 pixels (5 um^2), we find 33 RBCs. Using our assumptions, we get 2.7e-4 uL / 5 um^2 blood volume per unit area of the image. Concentration is # parasites / the area of the entire image (4 parasites / 3114261 pixels). Scaling this up to 5.5L in a human, we get 82 million parasites in this person’s bloodstream.
How we used Image J to get a scale bar:
View in Media Gallery
The ImageJ interface
View in Media Gallery
Using ImageJ to approximate the blood volume per unit area of the image. 33 RBCs are highlighted in the image area.
View in Media Gallery
Measuring the number of pixels in the field of view.
View in Media Gallery
Measuring the number of pixels in the field of view.
Sign in to commentNobody has commented yet... Share your thoughts with the author and start the discussion!

 0 Applause
 0 Comments