Calibration factor
 Aug 02, 2015 • 10:25 PM UTC
 Unknown Location
 140x Magnification
 Unknown
Manuel Gomez
Learn about the author...
3posts
0comments
1locations
View in Media Gallery
I am working on a quantitative project with the foldscope, and I thought I should share here an important part of it. Let’s say that we want to measure a length or area in a sample, for example the length of a cell. We take an image, and the cell is, for example, 50 pixels long. But pixels are not a unit of length that we can use to compare with other measurements because, in general, pixels in my microscopy setup have different size than pixels in other person’s setup. In order to fix this issue, we need to calibrate our microscope, and obtain the calibration factor. The calibration factor (f_cal) is the average length of the pixels in the images rendered by a microscope, and is going to depend, in general, in the microscope’s lens and camera. It’s units are microns per pixel. If we multiply the adequate f_cal by a length in pixels, we obtain the actual length in microns.
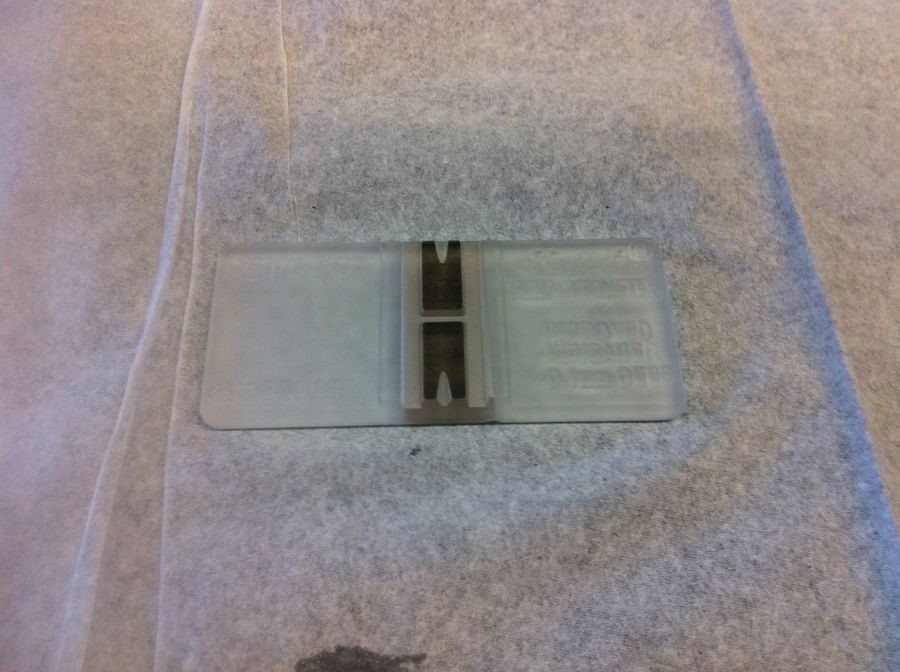
The question now is, how do we obtain f_cal in an actual experiment? By taking an image of a structure whose length we already know. I have used a square grid, provided by a hemocytometer. The grid is engraved in the “metalic” structures in its center:
The question now is, how do we obtain f_cal in an actual experiment? By taking an image of a structure whose length we already know. I have used a square grid, provided by a hemocytometer. The grid is engraved in the “metalic” structures in its center:
View in Media Gallery
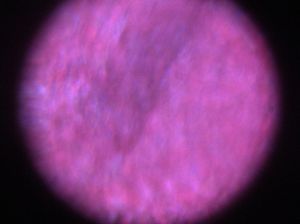
A hemocytometer provides a handy square grid The biggest problem that I found is that the hemocytometer is too big and too thick, and it is difficult to use it with the foldscope, specially with the high magnification lens. Here, I will show only the results for the low magnification lens. Under this lens, the grid looks like the following image:
View in Media Gallery
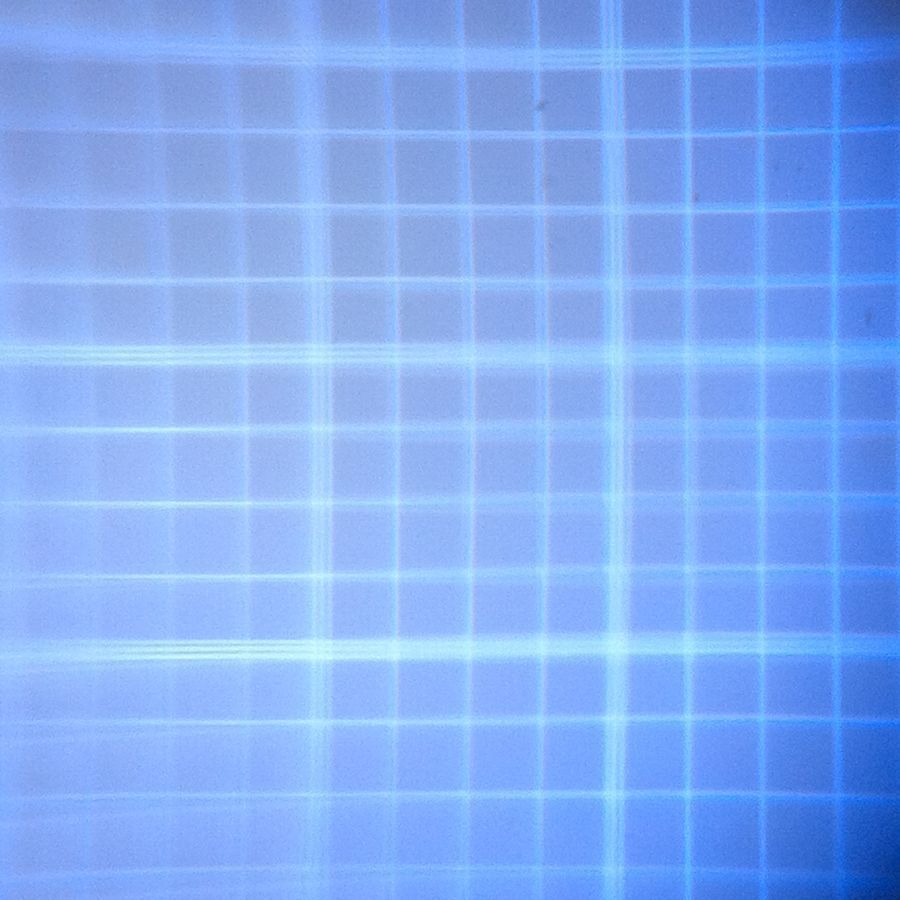
Square grid used to calibrate the foldscope The smallest squares have a 50 micron side, while the square delimited by the triple-lines have sides that measure 200 microns. It should be noted that, in general, by using larger structures we will reduce the error in the determination of f_cal. Given that the actual grid is perfectly square, the image shows a small pincushion distortion.
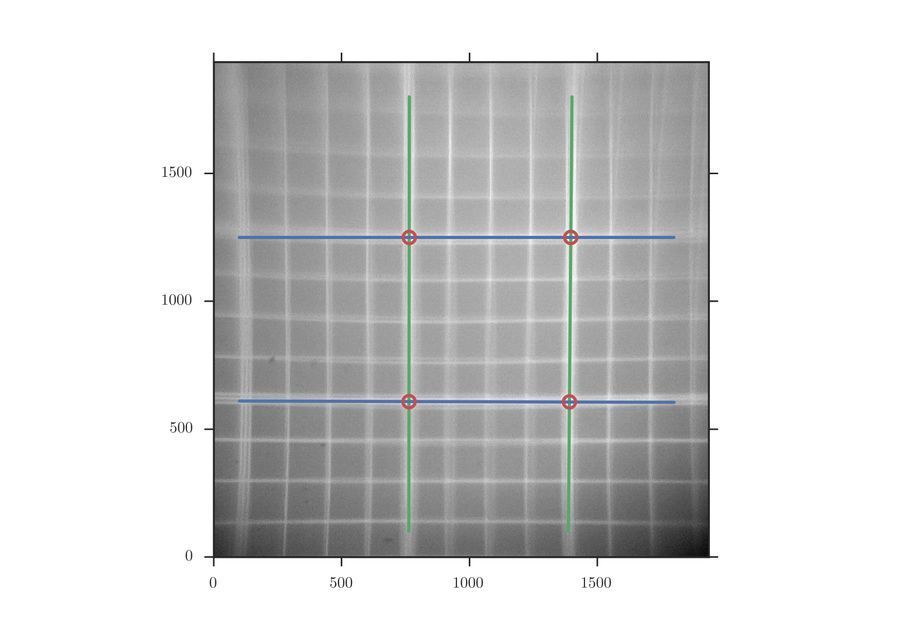
In order to obtain f_cal, we draw two “horizontal” and two “vertical” lines on the image following the triple-lines, and find their intersections, as shown in the following image:
In order to obtain f_cal, we draw two “horizontal” and two “vertical” lines on the image following the triple-lines, and find their intersections, as shown in the following image:
View in Media Gallery
Characteristic points used to calculate f_cal
The intersection mark a square which side’s length we know. The final step is to divide the square side’s length, in microns, by their length in pixels. Since we have four segments, we average over the four measurements. For my cell phone and the low magnification lens, I obtain:
f_cal = 0.32 microns/pixel.
Finally, in order to calculate f_cal, I wrote my own python script that presents the image, and the user just inputs each line by clicking on two points. If anyone might find it useful, I can upload it here.
Sign in to commentNobody has commented yet... Share your thoughts with the author and start the discussion!
 0 Applause
 0 Comments